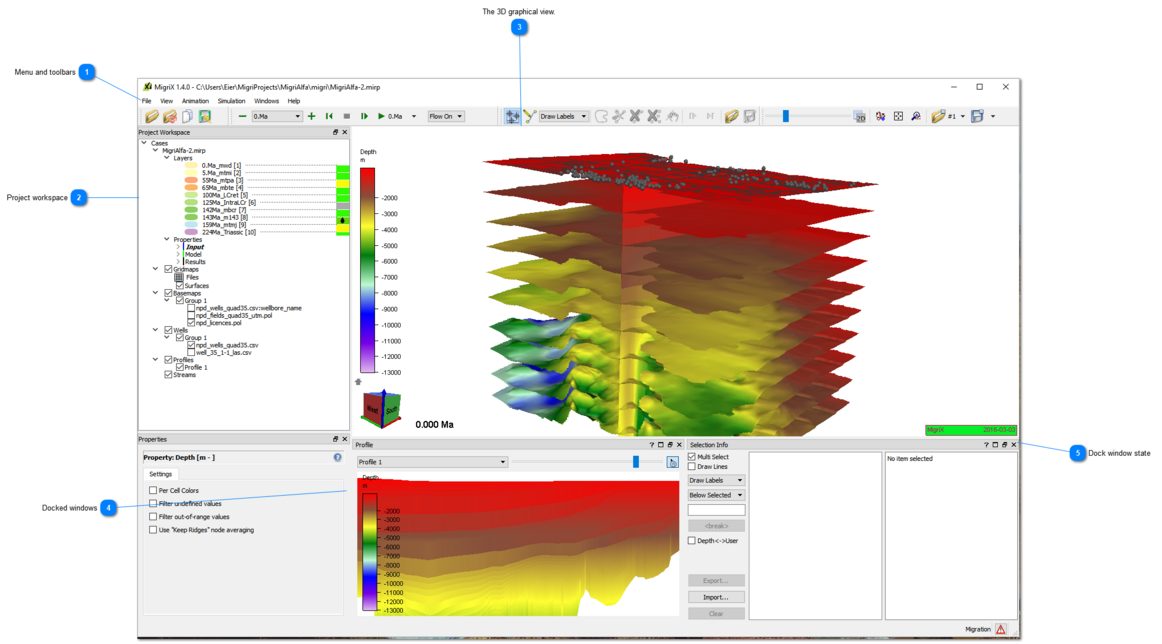
The user interface of MigriX can be divided into four main components (Figure 5.1). The central component containing the 3D graphical view cannot be closed by the user and will always be visible. All other windows can be either hidden or visible at all times, depending on the user preferences. The windows can be either docked (locked to a part of the user interface), undocked (floating) or maximised. Window states can be changed from the Windows top-level menu or by clicking on the buttons in the upper right corner of the window
Figure 5.1: Main MigriX user interface components.
Menu and toolbars
A set of toolbars provides easy access to the most frequently used operations in MigriX. The toolbar layout can be arranged freely (vertically or horizontally across one or multiple rows) by dragging the toolbar handles. Toolbars can be added or removed either in the Windows/Toolbar top-level or from the <RMB> menu in the toolbar area.
The different top-level menus are described in the menus chapter.
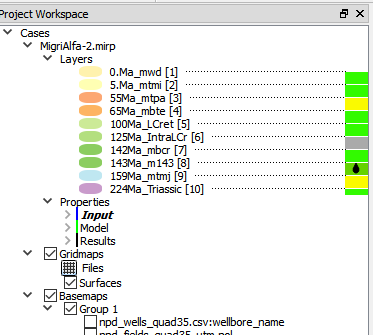
The Project workspace consists of a tree containing the layer model (Layers folder) and all input parameters (Properties/Input folder) and simulation results for the model. It also contains other project data, such as Gridmaps (imported grids), Basemaps (polygon and line cultural data), Wells, Profiles and Streams (flowpaths). The Properties panel, which by default is located below the Project workspace tree, is used for editing input parameters and changing settings for the various result types. The Properties panel will display the settings and parameters only for the currently selected layers.