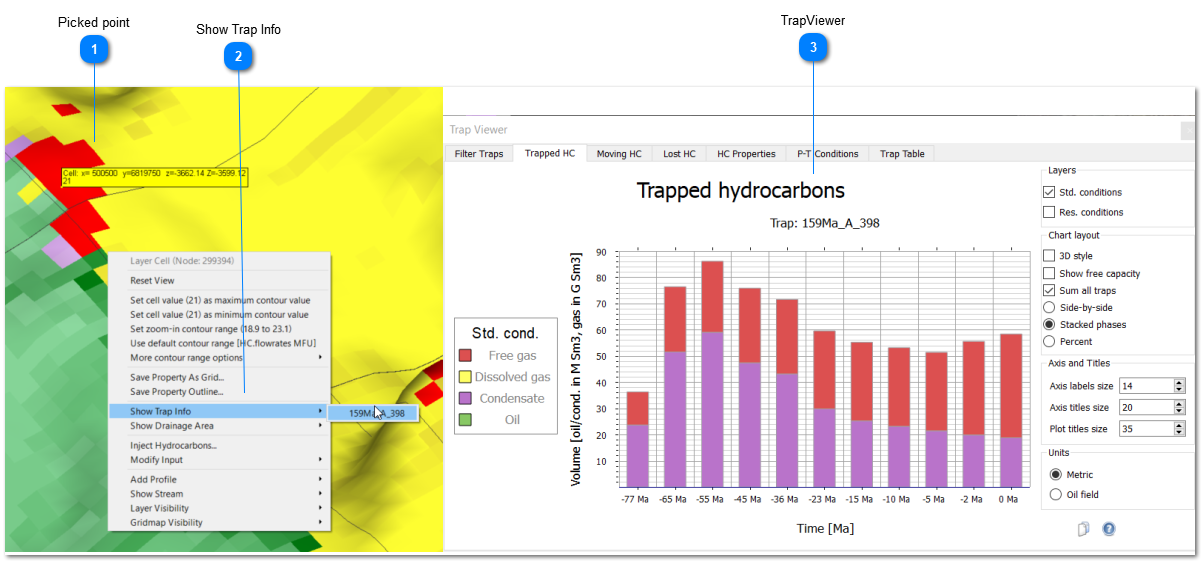
The TrapViewer window (Figure 5.147) offers features for visualizing trap histories over time in the form of graphs and tables. You can choose individual traps in the 3D view by selecting points at trap locations and then choosing "Show Trap Info" from the right-click menu. If you want to combine multiple traps for joint plotting, you can do so in the Filter Traps tab.
In the TrapViewer, you have the capability to examine various aspects, including Trapped HC, Moving HC and Lost HC volumes in traps. You can also plot HC properties such as density and GOR, and P-T conditions. The Trap table resents a tabulated view of all trap properties over time.
Figure 5.47: Viewing trapped volumes through time in TrapViewer for a picked trap in 3D view.