MigriX allows importing of cultural data to the Basemaps folder in the ProjectWorkspace and plot the data as lines or points in 3D space or mapped onto layers or gridmaps. Variousdata formatsare supported includingCSV, Irap and Zmap ASCII formats.
Data files are imported by right-mouse clicking on the Basemaps folder (or any subfolder) and selecting either of the Import to new group, Import as lines or Import as points options. When using the import as lines option with multi-column data (e.g .csv formatted files), the user must also select which of the columns that should be imported as text labels. Options for deleting, copying and renaming the sub-folders are also available from the <RMB> menu.
The Add Lines... options allow for loading of various types of line data from the model. The available data types are listed in Table 3.11 in the Basemap input data section. Most of these options require that a point has been picked first. The lines will be fetched only for this point ("Picked" options), or for the layer ("Layer" options) which the point is picked on. These data only exist within the session and will be removed next time the project is opened.
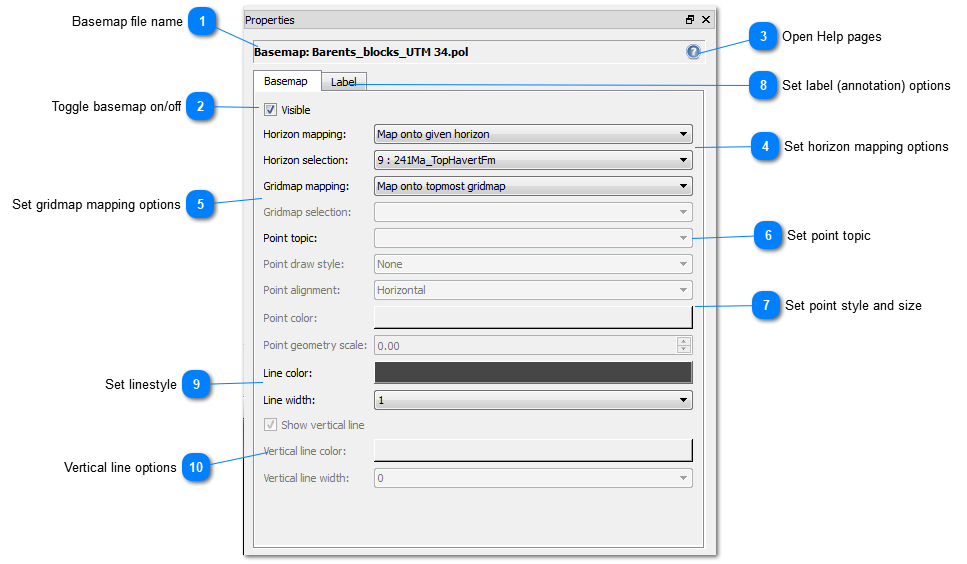
The options for mapping line data and text labels onto surfaces are found in the Basemap properties panel. The Basemap tab (Figure 5.10) is used for defining surface mapping and line style options, while the options specific to text labels are found in the Label tab.
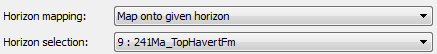
The Horizon mapping option allow to user to either map onto all layers, the uppermost layer or onto a specific layer. The data can also be posted at the z-value location or at z = 0. If the Scale between horizons option is chosen, the scaling (transformation) of the z-axis between model layers will be accounted for. The data points will then move with the model when looking at reconstructed timesteps.
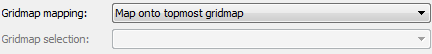
The Gridmap mapping option allow to user to either map onto all gridmap, the uppermost gridmap or onto a specific gridmap. The data can also be posted at the z-value location or at z = 0. By default, mapping onto gridmaps is deactivated.
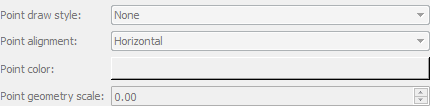
For point data with text labels (e.g. csv files imported with Import as points option) , the user can choose how to display the text in the Label tab. The Show covered option will, when enabled, ensure that all labels are visible, even when multiple points are loaded at the exact same location. The show background and show marker options are used for turning on/off the label backgrounds+border and point markers. The colour of each of these components can also be changed along with the font size and style.
The show vertical line option enables drawing of a vertical line with specified colour and width from seabed down to the each of the points .The colour and width of the vertical line can be changed