MigriX provides the capability to import well data into the Wells folder within the Project Workspace. This imported data can be visualized as lines or points in 3D space or mapped onto layers or gridmaps. MigriX supports a variety of data formats, including LAS well logs and CSV tabular text files. Additionally, you can directly extract data from the geomodel by using the Wells/Group/ImportTable option.
To import data files, you can right-click on the Wells folder (or any subfolder) and select either the "Import File" option or the "Import File to new group" option. The right-click menu also offers options for deleting, copying, and renaming sub-folders. To make the loaded well data persistent between project sessions, you can choose the "File->Save cultural data" option.
The "Import Table..." options allow for the loading of various types of model table (points) data. You can refer to table 3.9 in the well data chapter for a comprehensive list of available options. It's important to note that these data only exist within the current session and will be removed the next time the project is opened.
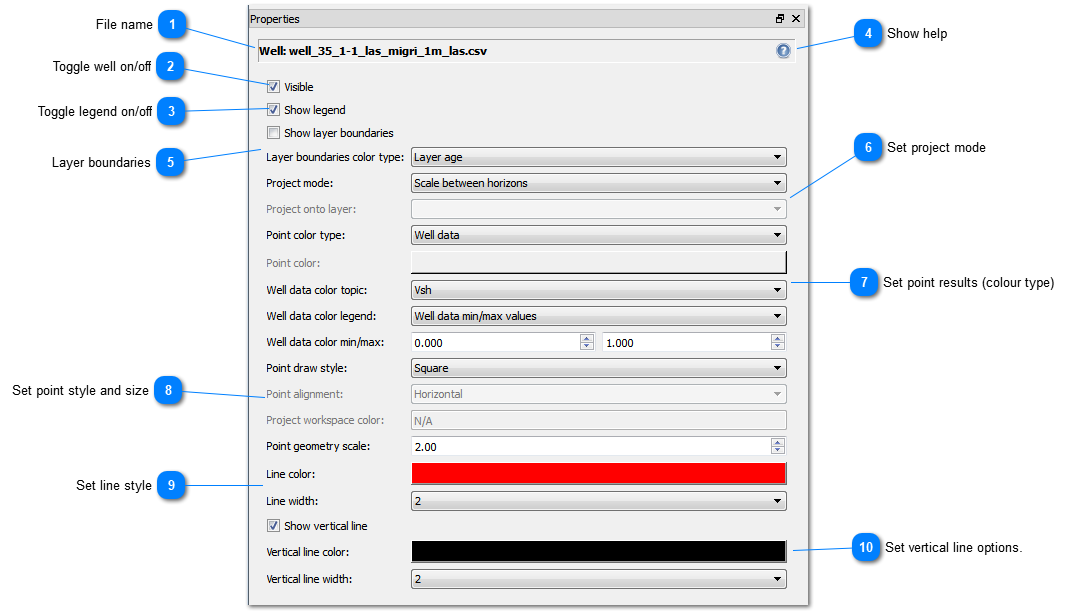
You can configure how the wells are displayed in the 2D and 3D views by accessing the Well properties panel (Figure 5.11), which will be discussed below.
Figure 5.11: The well properties panels.
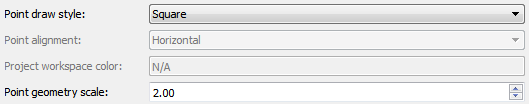
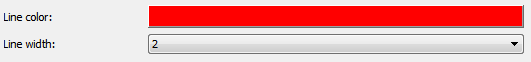
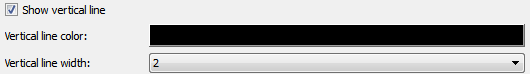
A variety of point draw styles and primitives are available, including spheres, discs, cubes and spikes. If the well data set is very large, the Spheres (low-res) style should be considered, as this is significantly faster than the other styles. The size of the points can be changed in the Point geometry scale field. If the data points are sparse (e.g. vitrinite or pressure measurements), the well path connecting the points can be shown by checking the Show vertical line option. The line colour and width may then also be specified.
The Show layer boundaries option will when enabled, mark the depths at which layers cut through the well. They can be coloured according to layer age or the selected property for the well (Point colour type). Not supported yet in Migri 2 releases.
The wells points will be either projected onto one or more layers or plotted at the present day depths (z-values), depending on the selection in the Project mode menu. If the Scale between horizons option is active, the points will be automatically scaled between the model layers and move along with the layers when older (reconstructed) timesteps are viewed.
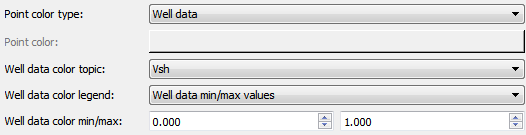
The results shown for the well data points are defined in the Point colour type pull-down menu. It can either show the current value for each point from the model (project workspace option), a fixed colour (Point color option) or data values from the well file itself (well data option). In the latter case, the user must also select which data type to use (well data color option) and decide if the results should be plotted using the current workspace legend or if a separate legend should be used (Well data min/max values option). If a separate value is used, the minimum and maximum values can be entered (Well data color min/max fields).
The show vertical line option enables drawing of a vertical line with specified colour and width from seabed down to the each of the points. The colour and width of the vertical line can be changed