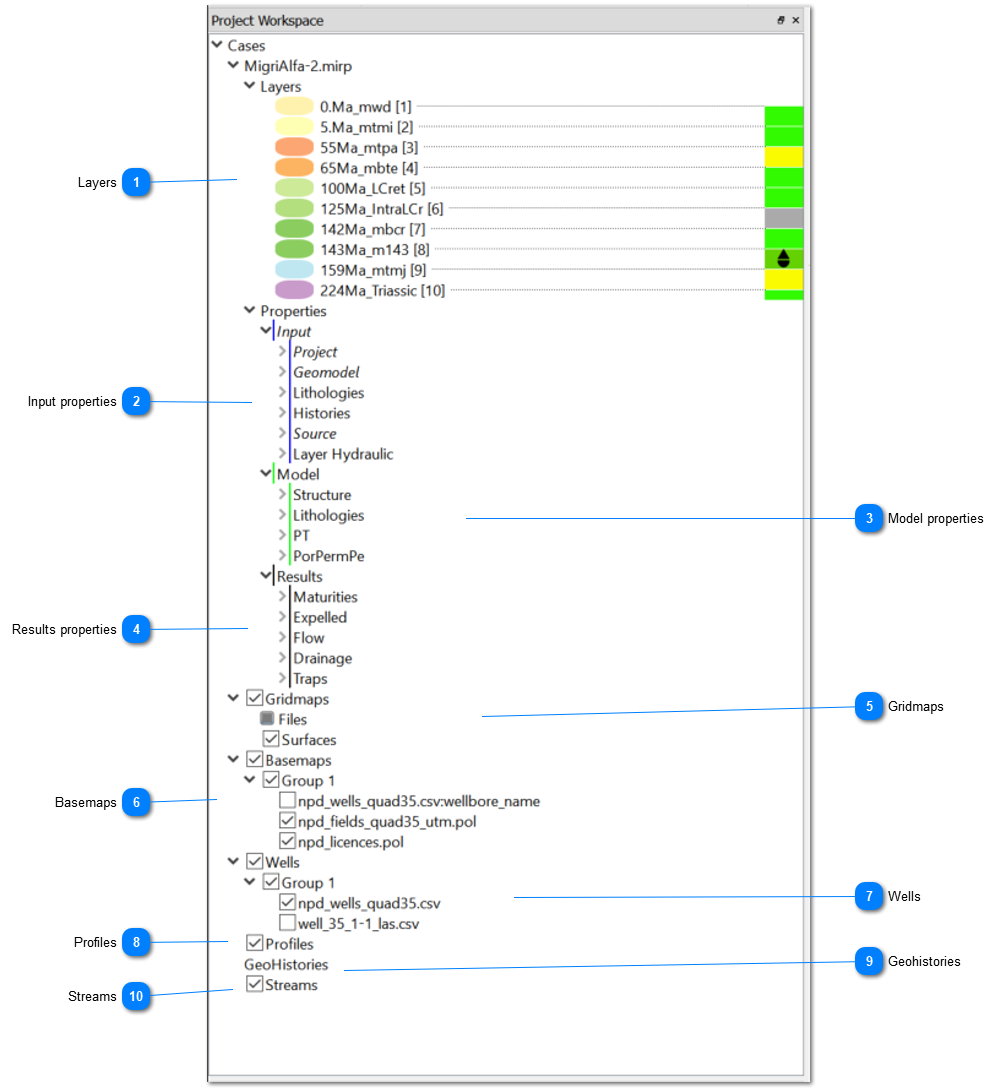
Project workspace (Figure 5.4) is the main panel for navigating between, picking and modifying layer properties and setting the viewing options for the 3D view. It is required for making use of the Layers and the Gridmaps, Basemaps, Wells, Profiles and Streamstools of MigriX. The window is activated from Windows/ProjectWorkspace.
Figure 5.4:The content of Project Workspace when a project with10 layers has beenloadedinto MigriX.
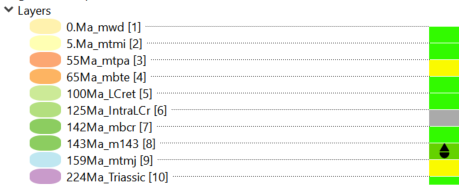
Layers
The layers that have been loaded into MigriX are all listed in the Project Workspace as shown in this area. The layers are coloured according to geological age in the leftmost column and according to main lithology in the rightmost column. Source rock layers are indicated by an oil droplet. See the Layers description for more details.
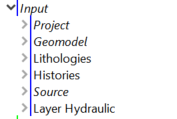
The Input section in the project workspace contains all input parameters to MigriX. The property input values can be edited in the model editors or in the Properties window and the current property values are plotted in the 3D view. See the Input properties description for further details.
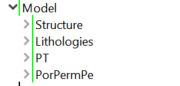
The Model section contains properties related to the MigriX geomodel. All property types in this group can be viewed without needing to run a simulation first. See the Model properties section for more information.
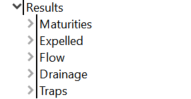
The results part of the project workspace contains all properties that require a simulation run to be completed before they can be viewed. See the results properties chapter for more details.
The Gridmaps feature allows user to import and visualise grids, regardless of grid resolution and whether or not the grids are within the current model AOI. This functionality is described in the gridmaps chapter.
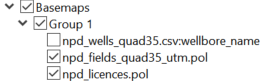
MigriX allows importing of cultural data to the Basemaps folder and plotting the data as lines or points in 3D space or mapped onto layers or gridmaps. See the basemaps chapter for more information.
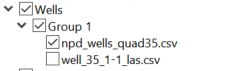
Well (xyz) data can be imported to the Wells folder in the ProjectWorkspace and plot the data as lines or points in 3D space or mapped onto layers or gridmaps. See the wells chapter for further details.
Profiles are created from the 3D view by using the <RMB> menu and selecting one of the Show Profile options. Profiles can be either through a digitized point (E-W or N-W), along a picked flowpath or along a digitized line. The new profiles are added to the Profiles folder in the Project Workspace. See the profiles chapter for more information
The GeoHistory functionality allows for viewing the burial history and property evolution at a model location. To create a new GeoHistory plot, pick a point in the 3D view and choose the Add Geohistory option from the <RMB> menu. The Add GeoHistory option is only available at the final timestep after a simulation has been completed. See also the GeoHistory chapter.
Streams are used to visualize the flow-paths from single or multiple points in the model at the timestep the simulator has reached. New streams can be added from the Show streams entries in the <RMB> menu in the 3D view after a timestep has been simulated. See the Streams and Flowpaths chapters for more information.