The Gridmaps feature enables the import of grids in any of the supported grid formats, regardless of whether these grids are located within the current model Area of Interest (AOI). These grids can vary in size and resolution. Within the Project Workspace, the Gridmaps folder includes the Files and Surfaces subfolders (see Figure 5.26). The Files folder serves as a repository for all files imported into the project, while the Surfaces folder contains the geometric elements displayed in the 3D and 2D views. Each Surface element consists of two grids, one for geometry and the other for results. An example of this is the Temperature property displayed on top of the Middle Jurassic depth map, as shown in Figure 5.34. The entries in the Surfaces folder only contain references to the grids stored in the Gridmaps/Files folder. New grids can be imported by right-clicking on the Gridmaps/Files folder and selecting either "Import to New Depth Group" for depth maps or "Import to New Property Group" for all other grids. It is also possible to manually create subfolders and then import the grids.
For depth maps, MigriX will make an attempt to automatically detect whether the z-values of the grids should be negated or if the input data is in feet instead of meters. Users have the option to adjust the scaling of the grids in the Files folder by editing the "Conversion factor" field in the Files/Properties panel (see Figure 5.27). For instance, if the input grids are in positive feet, the "Conversion factor" field should be set to -0.3048 to convert the geometries to negative meters, which is the standard unit in MigriX.
Figure 5.7: Gridmaps folder in the Project Workspace view.
Figure 5.8: Gridmaps/Files properties.
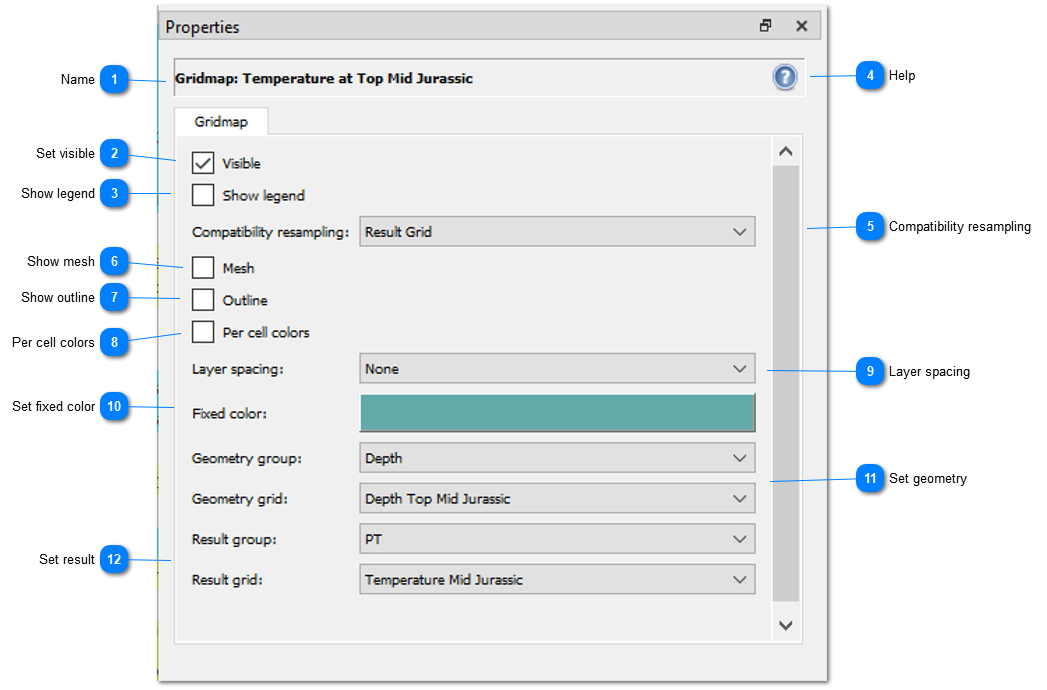
The Gridmaps/Surfaces Properties panel, as shown in Figure 5.9, offers a range of settings to manage the visualization of surfaces in both 3D and 2D views. It encompasses many of the features found in regular layers, such as the display of the legend, mesh and outline. The user needs to specify the combination of the geometry and result grid to be uses.
Figure 5.9: Gridmaps/Surfaces properties.
Name
Name of the gridmap. Same as shown in the Project Workspace tree.
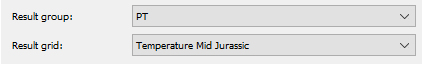
If the geometry grid and result grid are of different resolution, the user can decide which resolution the gridmap should follow by setting the Compatibility resampling option. By default, the resolution of the result grid will be used for the gridmap.
The Layer spacing menu is used to specify which of the layers the surface should follow when the modelled is stretched.. If set to None, the surface will not move when the layer model is stretched.
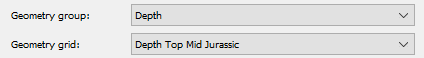
The Geometry group and Geometry grid options is used for selecting which of the grids in the Files repository that should represent the geometry of the gridmap.