Migris’ technology provides tools for modelling hydrocarbon migration in 3D at geologic timescales.
Oil companies use Migris’ technology to reduce their risks for drilling dry exploration wells and to explain dry wells and discoveries that have been made. The technology implemented by Migris is based on documentation in a series of Publications.
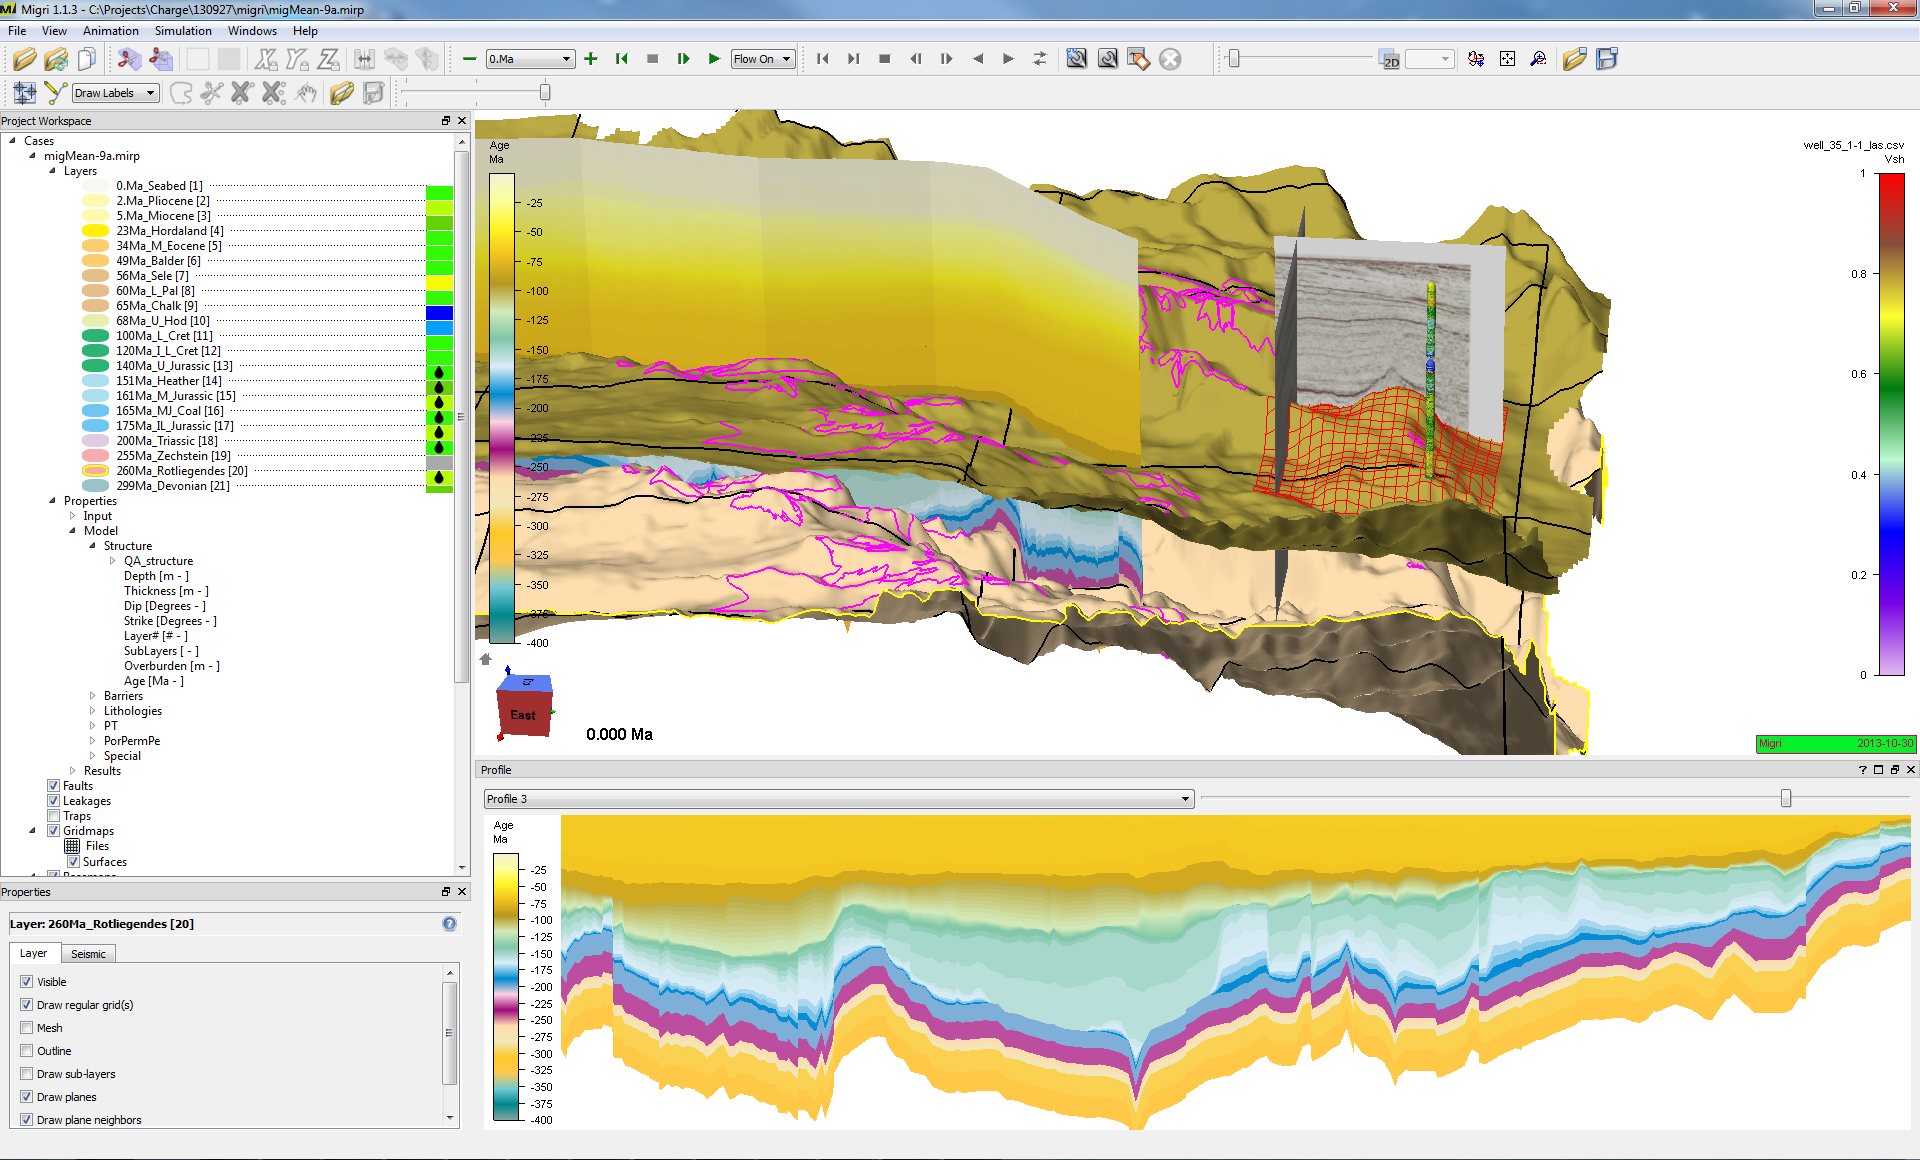
The Software
Migri combines probabilistic Monte Carlo techniques with migration modelling to reduce geological uncertainties and assess the petrolem systems and charge risks in the exploration acreage. The aim is to perform simulations at seismic resolution with complex geometries while retaining interactivity to allow for high turn-around of analysis results. The visualization solution is tightly coupled with the simulator in an interactive system. This enables exploration geologists to run many alternative scenarios in hours rather than days.
Migri uses the MigriAPI to access the simulator library and the GLview visualisation engine for 3d graphics. The graphical user interface of Migri has been built using modern cross-platform tools and libraries. Migri is accompanied by the free Migrino viewer, which can be used to view Migri 3D models and animations.
Migration Concepts
The Migri simulator was created based on concepts developed in the Dr. philos thesis of Sylta (2004). Most input properties to Migri are described as probability distributions with means and standard definitions. Migri can use default values for both, and therefore all Migri projects are automatically readied for stochastic simulations, e.g. using Monte Carlo sampling. The most important assumption that Migri builds upon is the conceptual model that the oil and/or gas saturations within each computing element cannot be assumed to be constant within that element. This is particularly evident in the modelling of lateral migration where thin cm-thick hydrocarbon stringers must be accounted for and the vertical saturation therefore may vary from a few percent to e.g. 30% over a few centimeters of vertical distance. The average oil and gas saturations within a 10m thick element can therefore not be related to the flow-rates, as in e.g. the Darcy equation applied to multiphase flow.
Primary migration is modelled within a high-resolution element description where each structural element is vertically subdivided into many sub-layers, each with its own permeability and entry pressure. The entry pressures will determine the vertical direction of flow, and hydrocarbons will flow in the direction of lower potential until a carrier is reached.
A carrier is in Migri defined as a flow unit (below a vertical barrier) that has sufficient permeability to transport hydrocarbons laterally over the time steps modelled. Migri will use the vertical sub-layer entry pressure structure to determine in which flow-units the hydrocarbons will migrate. The vertical saturation distribution is determined within each dynamic sublayer flow-mesh element and hydrocarbons are transported laterally into the next element.
Once the hydrocarbons have reached the trap, they will mix and the Migri PVT modelling will determine the trap phases of each sublayer trap. Lateral spill of oil and gas is modelled between each sublayer trap. At the same time the properties of the seals above and/or below the traps are used to determine if capillary leakage occurs. The vertical entry pressure distribution between each trap and carriers above or below are used to determine the static and dynamic seals and when these are overcome by the trapped hydrocarbons leakage is initiated. The area of the leakage zone is determined and the saturations, permeabilities and entry pressures determine the rate of leakage from each trap. Remigration between traps is thus modeled for each time step using the geometries and properties of the traps and seal at the reconstructed depths of the timestep.
When starting to model the next time-step the structural reconstruction of that timestep is used to remodel the shape of the traps and spill surplus volumes that no longer can be accommodated in the traps due to e.g. compaction. Thereafter, the generated volumes within the next timestep are added and migration is modelled.
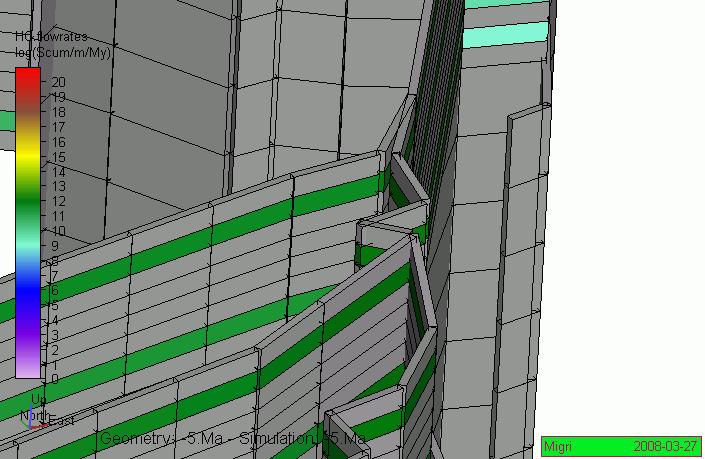
Layered models
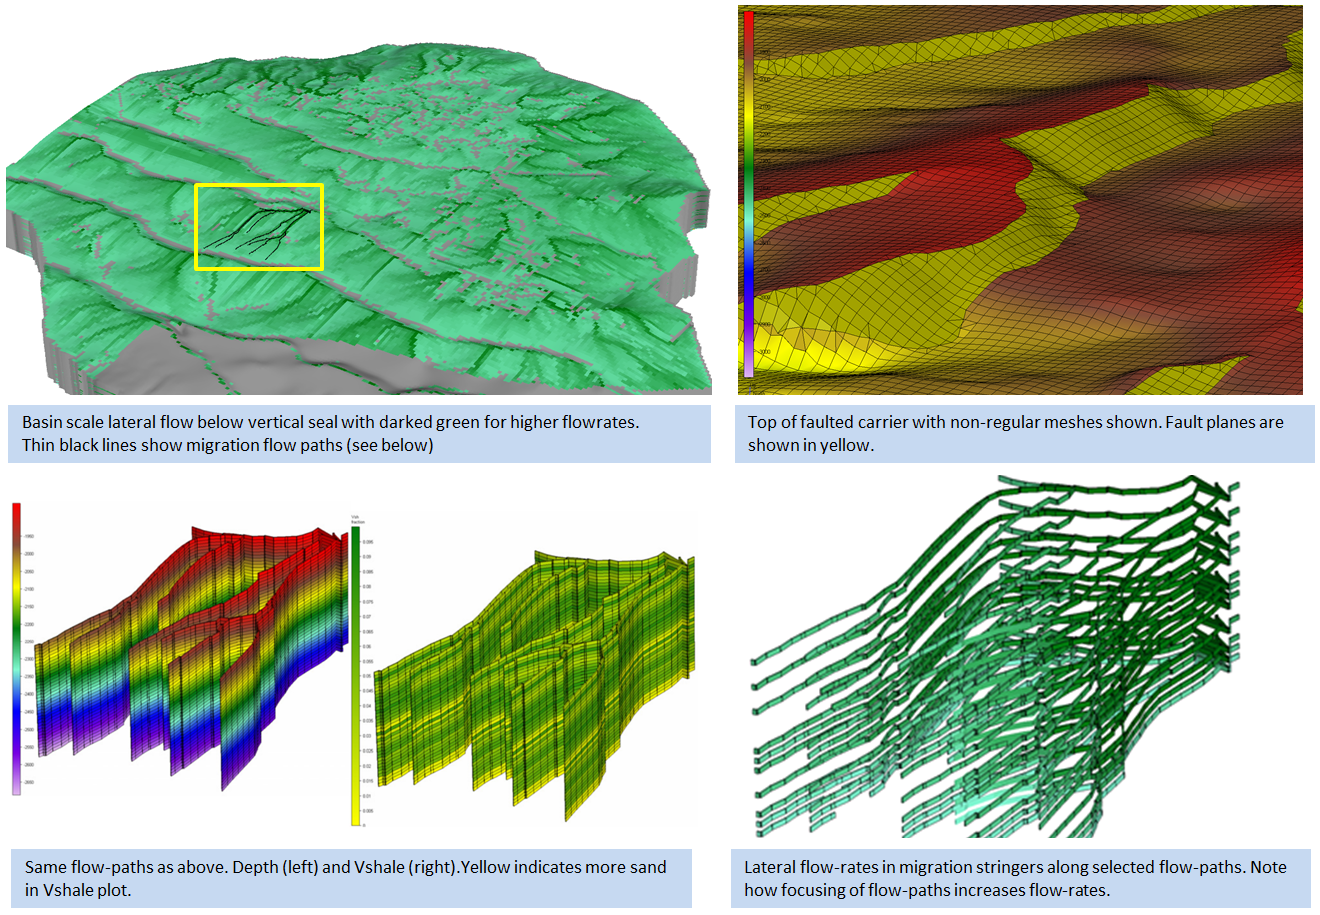
The 3D geological model is built from layers, but each layer can be split into many sub-layers. Lateral and vertical migration will account for the different flow properties with the sub-layers. Migri combines regular mesh elements in areas with little tectonic activity with non-regular mesh elements in areas with faulting. The regular eight-point mesh is split into mesh elements with fewer corners and with a more free orientation of the mesh sides. This allows Migri to perform a more accurate description of fault planes and the intersection between faults and horizons. The latter is important in the fault seal modelling that can be done with Migri. Migri uses a dynamic flow-path modelling approach. A single flow-path are dynamic elements that are recomputed in direction and size for each time-step modelled. Each geometrical element of the model may be subdivided into a number of flow-path elements. Migri has a very efficient numerical scheme for solving a first order differential equation for flow within each flow-path element, and is therefore able to compute migration stringer hydrocarbon saturations, column heights and migration velocities from the Darcy equation for two-phase flow.
Migri makes full use of the sublayer description when modelling migration within low-permeability rocks. The same concept is used for the primary migration modelling and capillary leakage modelling. The numerical solutions differ, however, in order to make the computations more accurate and also faster. During leakage modelling, Migri will also account for hysteresis effects. These effects may result in a long term reduction in the effective entry pressures of the seal once the seal has been breached, reducing the sealing potential of leaking traps to less than the entry pressure seal capacity.
Migri is well suited to modelling the hydrocarbon migration within channel sands. Maps of Vshale derived from wells or seismic can be used to model migration up to and along sand pinchouts and the potential for stratigraphic trapping can then be assessed.
Fault Seal
The modelling of fault seal is an important integrated part of the Migri simulator and faults, or parts of faults, can be described as open, sealing or partly sealing to flow. The sealing criteria can use a combination of geometric and clay-smear concepts. The fault seal modelling allows for the modelling of hundreds or thousands of faults within a single migration model.
Results
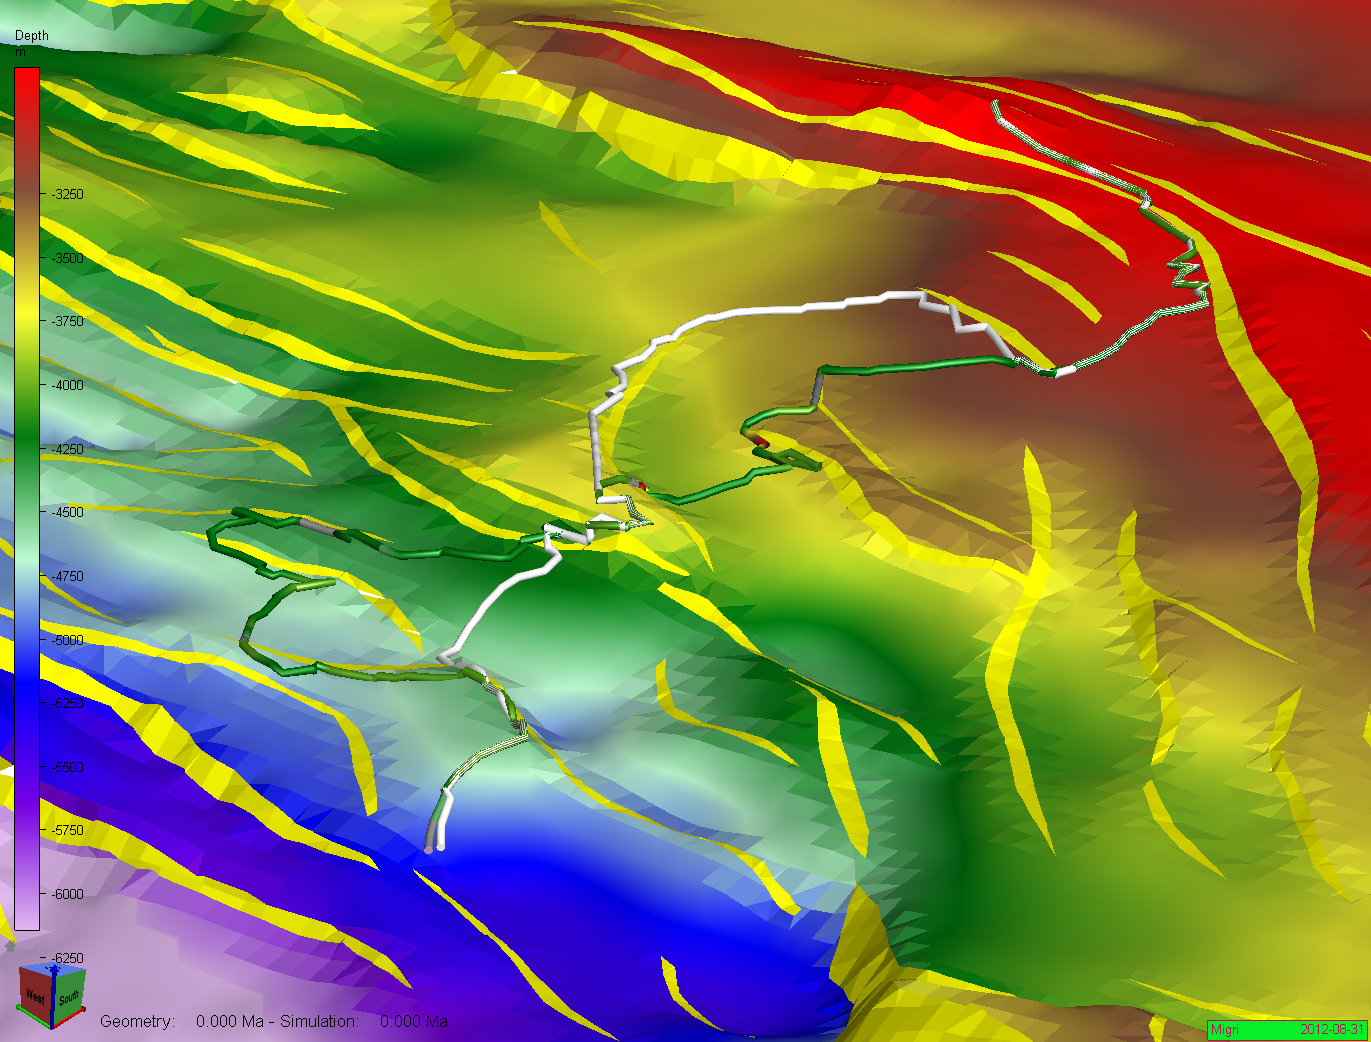
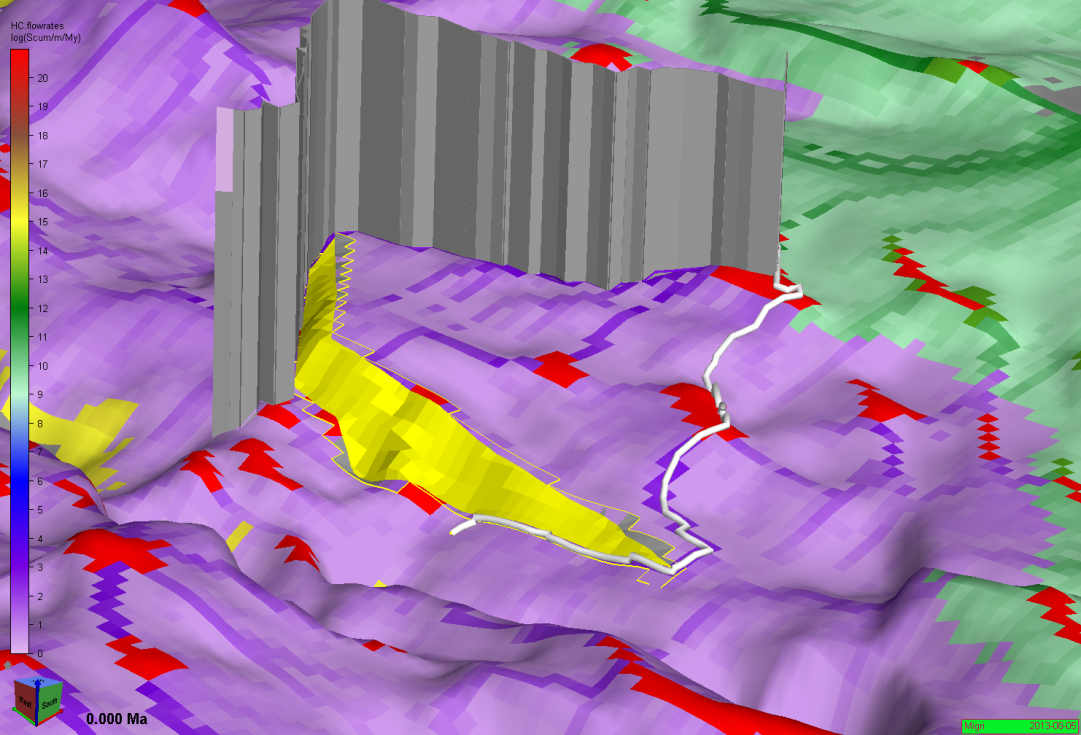
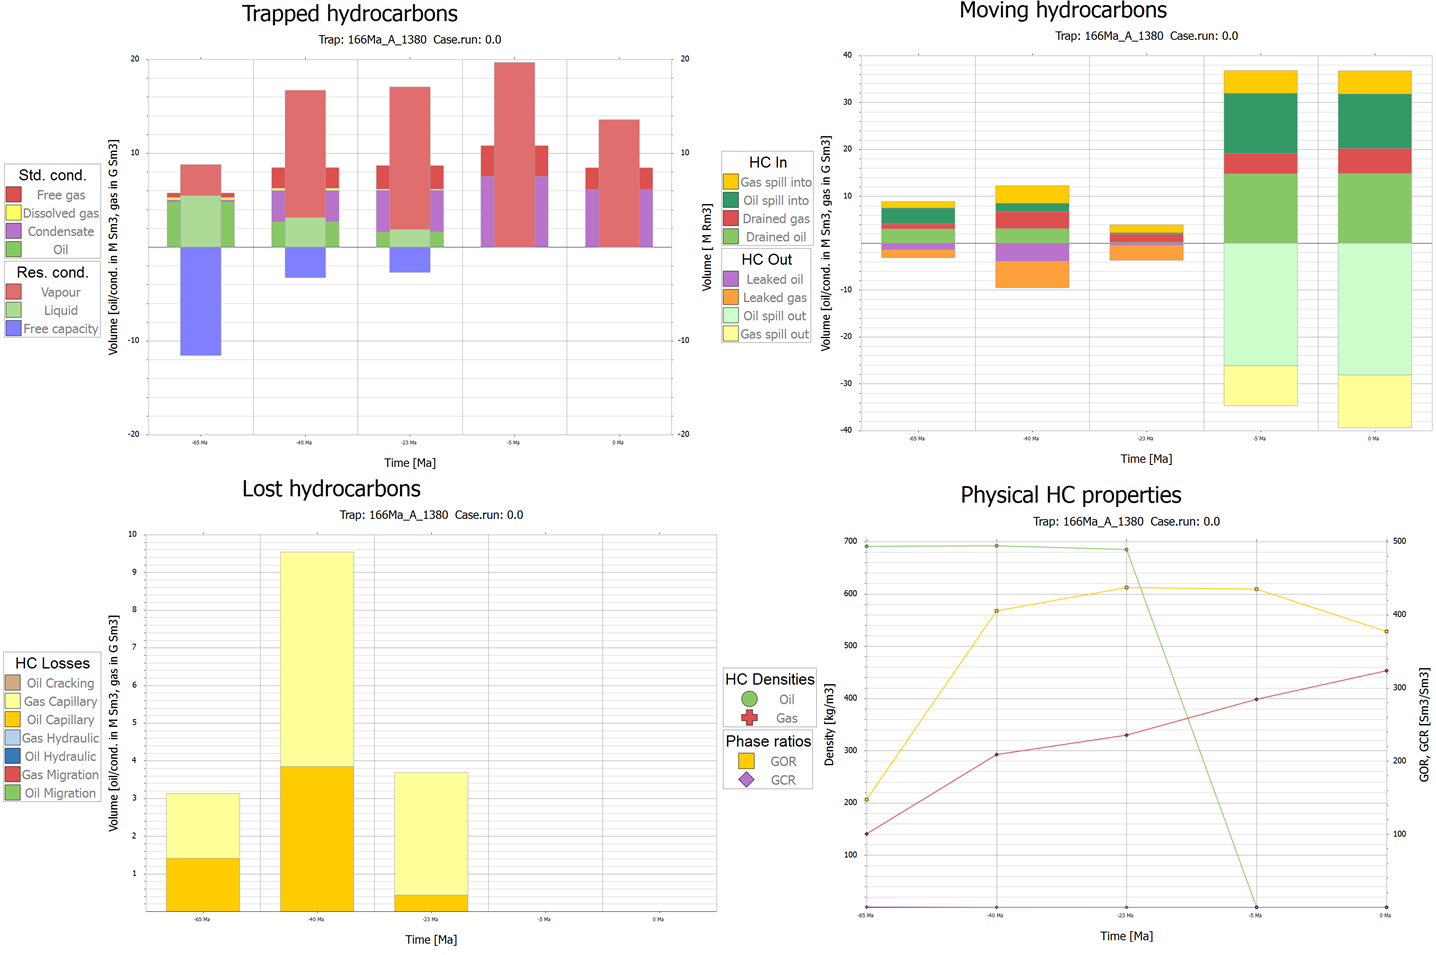
The results from Migri simulation are typically shown as flow-rate maps. These maps show the flow of oil and gas along migration carriers. Plots of trapped oil and gas versus time can also be dynamically studied during simulations and detailed fill/spill and leakage figures can be plotted.
Probabilistic simulations
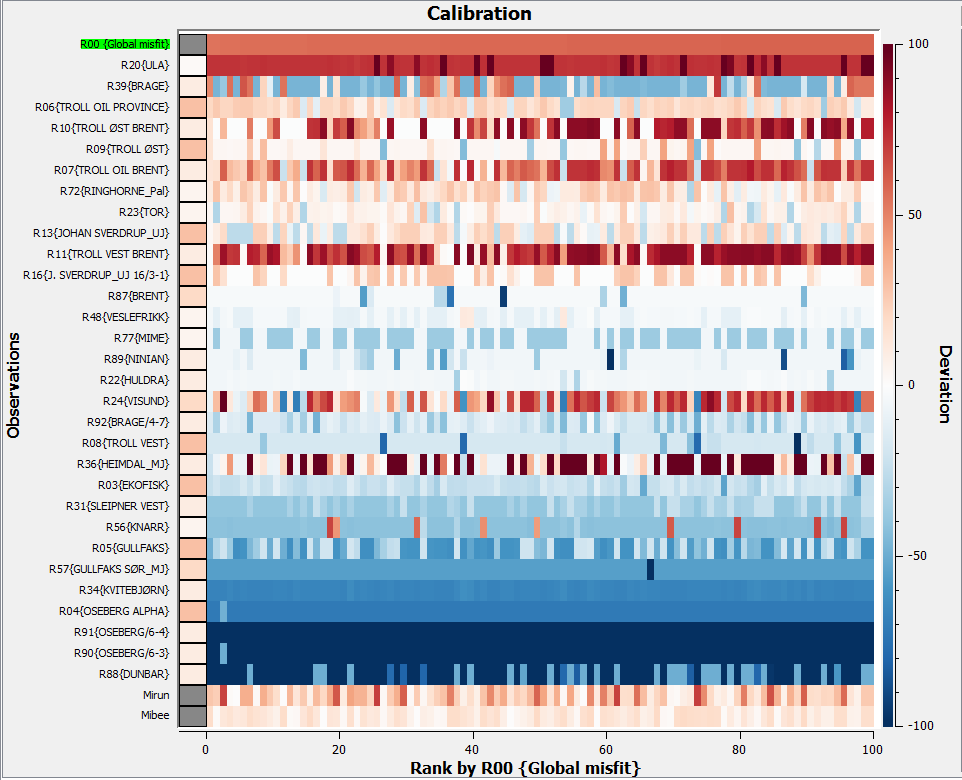
All input parameters and maps to Migri are provided as probability distributions. The model can be simulated either as deterministic runs (using the mean value of all parameters) or as probabilistic Monte Carlo simulations. The results from the probabilistic simulations are matched and weighted against calibration points, e.g. known hydrocarbon columns from exploration wells in the area. The input parameter values for the best simulations can be analysed, and a-posteriori input distributions can be derived and used as a basis for running new Monte Carlo simulations in an iterative manner.
The typical output from the probabilistic simulations are probability maps for different percentiles, e.g. P10, P50 and P90 maps for trapped column heights and volumes.
Publications
Interested in our publications? Be sure to check out our overview below!