New release of Migri software
Migris AS is pleased to announce the release of Migri version 1.2 which is available for download from migris.no with the following highlights:
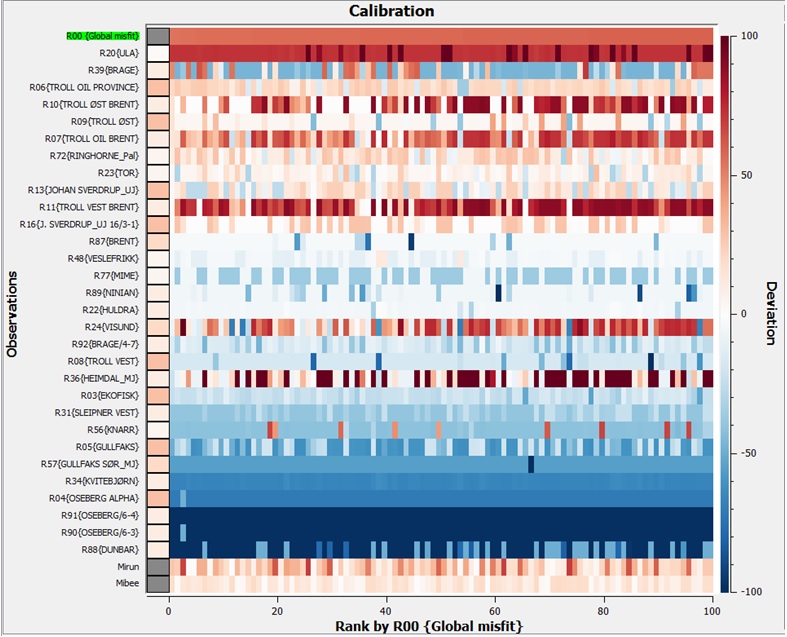
- New RiskChart tool – Analysis of misfit and input distributions of stochastic simulation series
- MigriBees can now be launched on remote servers, including Amazon computing cloud.
- New Quickplot tool – Make scatterplots, crossplots, histograms etc. of Migri data.
- Well and calibration data loading from SQLite database.
- Profiles are now draggable within the 3dview.
- Plot uncertainties (e.g. P90, P10, standard deviation) for input parameters.
See release news for a detailed list of improvements in Migri version 1.2. The RiskChart functionality has been used in our AAPG ACE Houston presentation to be held on April 7th.